

For the last two years, one of the most important questions in B2B marketing has been almost impossible to answer with data: how much business is AI actually sending us?
People now find brands by asking ChatGPT, Gemini, and Claude a question and clicking through to the answer. That traffic is real, it tends to arrive with high intent, and until recently it was effectively invisible inside Google Analytics, buried in the Direct and Referral buckets where nobody could isolate it.
That changed on May 13, 2026. Google added a native AI Assistant channel to GA4. Below is what shipped, why the native version only tells part of the story, and a full step-by-step walkthrough for building a proper AI traffic report in Looker Studio that you can put in front of a client or a board.
Why this reporting matters now
AI assistants have become a genuine discovery layer. Buyers open a chat window, describe their problem, and act on the tools and vendors the model surfaces. If your brand is the answer, you get a click from someone already deep in a buying mindset. If a competitor is the answer, you never see the visit at all.
Three reasons to start measuring this today, even if your volume looks small:
Measurement is step one. Being the answer is the real work. You cannot manage what you cannot see.
What Google actually changed
The update was published in the Google Analytics Help Center on May 13, 2026. You can find it in the official "What's New" announcements here: Google Analytics Announcements.
When GA4 detects a referrer that matches a recognized AI assistant, it now updates three traffic source dimensions at once, with no configuration required from the property owner:
In the announcement, Google names three platforms covered by the recognition: ChatGPT, Gemini, and Claude. Everything happens automatically inside your standard acquisition reports.
A couple of practical notes worth knowing before you rely on it:
The catch: the native channel is a floor, not a ceiling
Here is the part that separates a real report from a misleading one. The native AI Assistant channel is a useful start and a partial answer. It leaves out a meaningful share of your actual AI traffic in three ways:
If you report only the native number, you will undercount the channel that is growing fastest. The fix is to combine the native channel with a custom layer that recaptures the referral-based sources Google misses, then report the combined figure in a single view. That is exactly what the Looker Studio build below does.
Step by step: build the AI traffic report in Looker Studio
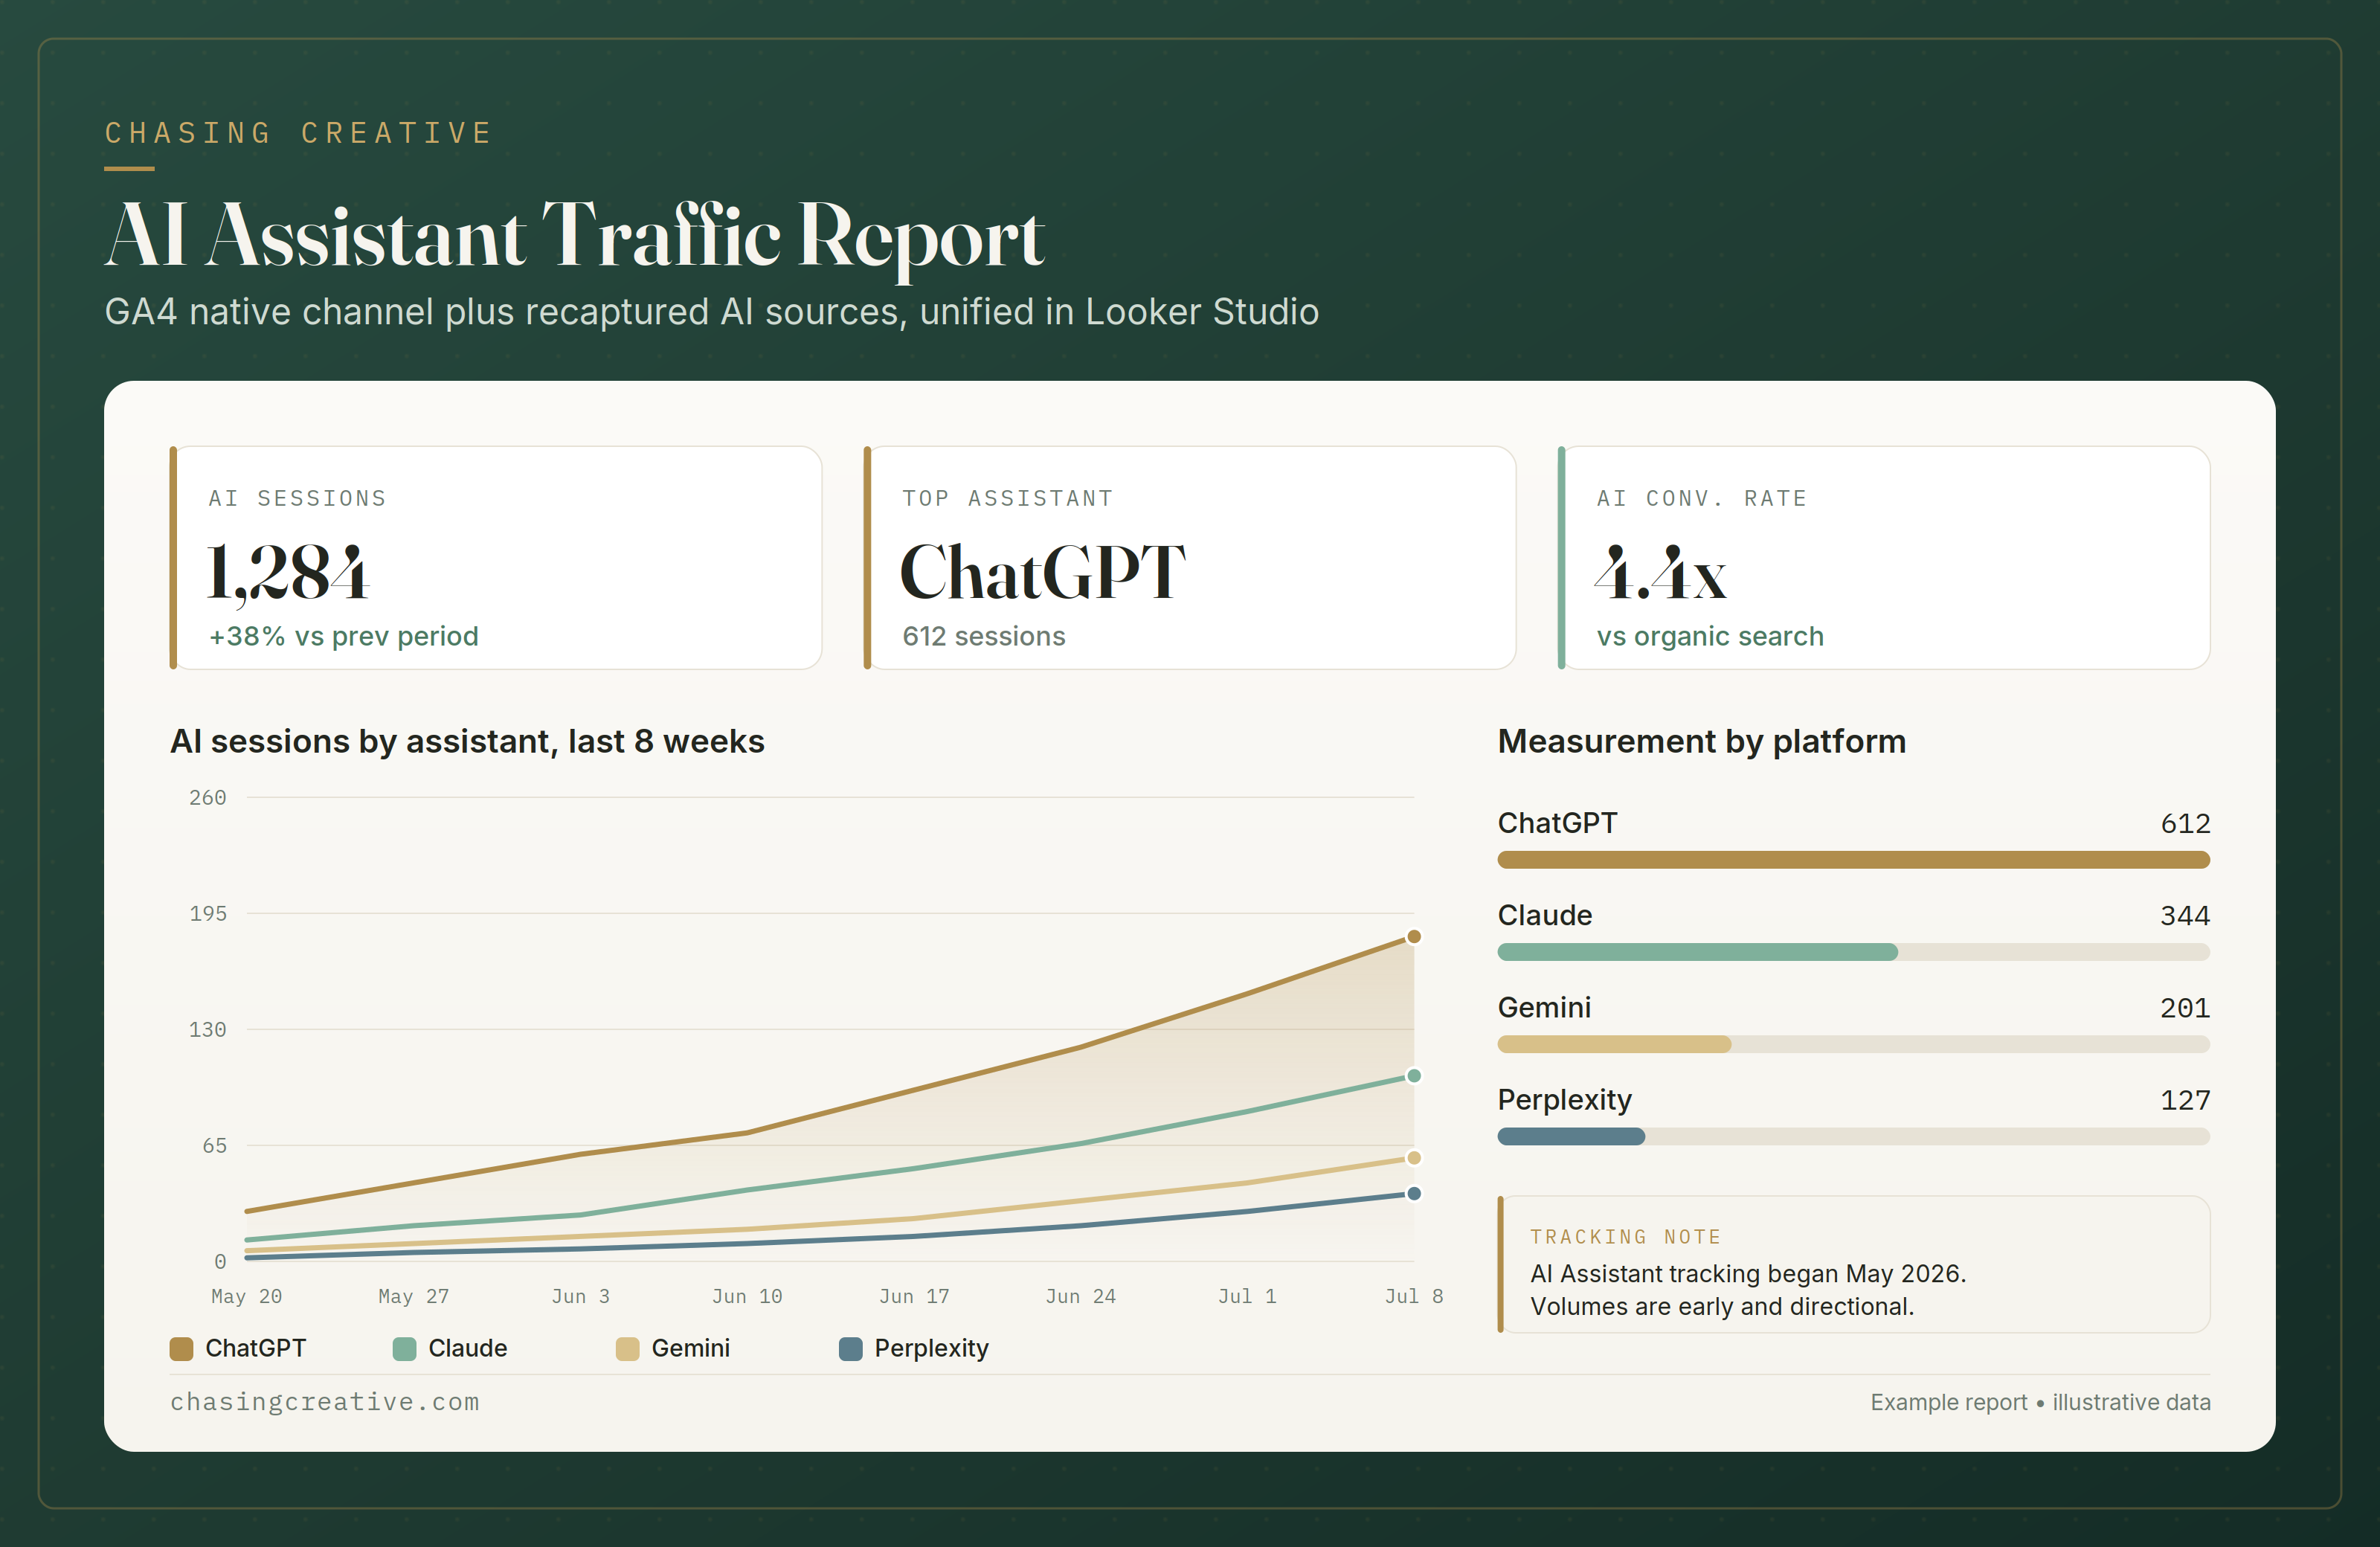
This is the setup we use for client reporting. It gives you a clean total, a breakdown by platform, and a trend line, all in one place.
Step 1: Create the native filter
In your Looker Studio report, add a filter using a single dimension:
Channel group is a sturdier choice than filtering on medium, because GA4 dimensions can behave unpredictably when you mix certain source and medium fields with metrics. One clause is all you need.
Step 2: Add a recapture field to catch what Google misses
Go to your data source, choose Add a Field, name it AI Traffic Source, and paste this formula:
CASE
  WHEN Session default channel group = "AI Assistant" THEN "AI Assistant (native)"
  WHEN REGEXP_MATCH(Session source, ".*chatgpt.*|.*openai.*|.*claude.*|.*perplexity.*|.*gemini.*|.*copilot.*|.*grok.*|.*deepseek.*|.*meta\\.ai.*") THEN "AI Assistant (recaptured)"
  ELSE "Non-AI"
END
The order matters. CASE evaluates top down and stops at the first match, so anything Google already classified gets the clean native label, and only the leftovers are tested against the regex. That prevents double counting. Refresh the regex every quarter or so, since new assistants appear constantly and a stale pattern quietly undercounts.
Now update your filter to point at the new AI Traffic Source field, set to RegExp Match with the value AI Assistant.*. That single condition captures both the native and recaptured buckets.
Step 3: Add a platform breakdown field
The native channel collapses every assistant into one label. To show which assistant is sending traffic, add a second field named AI Platform:
CASE
  WHEN REGEXP_MATCH(Session source, ".*chatgpt.*|.*openai.*") THEN "ChatGPT"
  WHEN REGEXP_MATCH(Session source, ".*claude.*|.*anthropic.*") THEN "Claude"
  WHEN REGEXP_MATCH(Session source, ".*gemini.*|.*bard.*") THEN "Gemini"
  WHEN REGEXP_MATCH(Session source, ".*perplexity.*") THEN "Perplexity"
  WHEN REGEXP_MATCH(Session source, ".*copilot.*") THEN "Copilot"
  WHEN REGEXP_MATCH(Session source, ".*grok.*") THEN "Grok"
  WHEN REGEXP_MATCH(Session source, ".*deepseek.*") THEN "DeepSeek"
  WHEN Session default channel group = "AI Assistant" THEN "Other AI (native)"
  ELSE "Non-AI"
END
That final native line is a safety net. It scoops up anything Google classified as AI that your regex did not name explicitly, so nothing silently drops into "Non-AI."
Step 4: Build the total sessions scorecard
Add a Scorecard. Set the metric to Sessions, leave the dimension empty, and apply your AI Assistant filter. The scorecard does not inherit chart filters automatically, so add it directly or your headline number will show total site sessions instead of AI sessions. Turn on the Previous period comparison so the number carries context. "14 sessions, up 40 percent" tells a story that a bare number does not.
Step 5: Build the platform breakdown
Add a Table or a Bar chart. Set the dimension to AI Platform, the metric to Sessions, and apply the filter. At low volume a table reads cleanest. Bars look better in a deck once the numbers grow.
Step 6: Build the trend line
Add a Time series chart. Set the X axis to Date, the metric to Sessions, and add AI Platform as the breakdown dimension so each assistant gets its own line. Turn off drill down so the chart stays put for the reader. In the Style tab, lock a consistent color per platform so ChatGPT stays the same color across every chart in the report.
Step 7: Frame it honestly
Add a short note on the page, something like: "AI Assistant tracking began May 2026. Volumes are early and directional." This keeps the small early numbers from being misread as either explosive growth or a failure, and it quietly signals that you were ahead of the curve by tracking this at all.
One honest limitation to keep in mind
Every method above depends on referrer data. It captures the AI traffic you can see, which is the referral-based share. It cannot attribute the referrer-less visits sitting in Direct, because that data simply is not present for any tool to recover. Closing that gap is a UTM discipline problem, not a filter problem. If you want to claw some of it back, tag your AI-driven links at the source with clear UTM parameters.
From measuring to earning: where AEO comes in
Measuring AI traffic tells you whether assistants are sending you business. Answer Engine Optimization, or AEO, is how you increase it. AEO is the practice of structuring your content so AI engines like ChatGPT, Gemini, Claude, and Perplexity cite it directly when they answer a buyer's question. Traditional SEO earns a ranking position. AEO earns the citation inside the answer itself. The goal shifts from being a blue link a buyer might click to being the source the machine quotes.
The reason this is urgent is a genuine shift in buyer behavior, and the data is not subtle:
Put plainly: when a buyer asks an assistant who belongs on the shortlist, the brands named win, and everyone else is invisible. That is a question you want your content to answer.
How this plays out in the industries we work with
At Chasing Creative we focus on B2B tech, data centers, critical infrastructure, SaaS, proptech, and manufacturing. AEO looks a little different in each:
In every one of these, the pattern is the same. The brand that has clearly answered the buyer's question in public is the brand the assistant repeats.
How content drives AEO
AEO is not a trick you apply after the fact. It is earned through content that answer engines can understand, trust, and quote. The research points in a consistent direction:
The practical moves that follow from this: answer the core question in the first sentence of a page, structure content with clear question-based headers and an FAQ section (like the one below), add schema markup so machines can parse it, cite real data rather than vague claims, and keep pages current. This guide itself is built that way on purpose. It is measurement and AEO working together: the report shows you what AI is sending, and the content strategy grows it.
Frequently asked questions
Yes. As of May 13, 2026, Google Analytics automatically recognizes referrals from ChatGPT, Gemini, and Claude and groups them under a native AI Assistant channel in your Default Channel Group reports. No setup is required.
It is a channel in the Default Channel Group that captures sessions where the referrer matches a recognized AI assistant. GA4 assigns those sessions a medium of
Google published the update in the Analytics Help Center on May 13, 2026. Broad availability across properties was reached in early June 2026, so some accounts saw data populate a few weeks after the announcement.
Two common reasons. First, the update is not retroactive, so only traffic from launch forward is classified and your history stays in its old channels. Second, rollout was gradual, so a property that received the update late may show little or zero data for a few weeks. That is timing, not missing traffic.
No. Perplexity is not part of the native recognition and still lands in Referral. Google AI Overviews are counted as Organic Search. To capture these, you need a custom field in GA4 or Looker Studio that recaptures them by source.
No. Classification starts from the launch date forward. Sessions before then keep their original channel assignment, so your clean AI baseline effectively begins in May 2026.
The native channel collapses every assistant into one label. To split it by platform, build a calculated field in Looker Studio that maps Session source into named platforms like ChatGPT, Claude, and Gemini, then use that field as a dimension in a table or chart.
A large share of AI-referred visits arrive without a referrer header. Without a referrer, GA4 has no signal to classify the session, so it defaults to Direct. No filter can recover these, since the data is not present. Disciplined UTM tagging on your AI-facing links is the only way to claw some of it back.
It tends to. Visitors arriving from AI assistants often come with refined, high intent, having already described their problem to the model. This traffic frequently converts at a higher rate than other channels, which is why it is worth tracking even at low early volume.
Filter on Session default channel group equals AI Assistant for the native view, then add a custom recapture field to catch sources Google misses. Pair a total sessions scorecard, a platform breakdown, and a trend line to give a complete picture. The full step-by-step is in the guide above.
Let us build it for you
Setting this up correctly means understanding the native channel, its blind spots, and how to stitch a complete picture together without double counting or overstating a small number in front of a client. That is exactly the kind of measurement work we do every day.
At Chasing Creative, we build analytics and reporting systems for B2B tech, data center, and infrastructure brands that make the fastest-growing channels visible and actionable. If you want a Looker Studio report that shows your full AI footprint, set up properly and framed for the people who read it, we can build it for you.
Get in touch with Chasing Creative and we will get your AI traffic measured right.

